
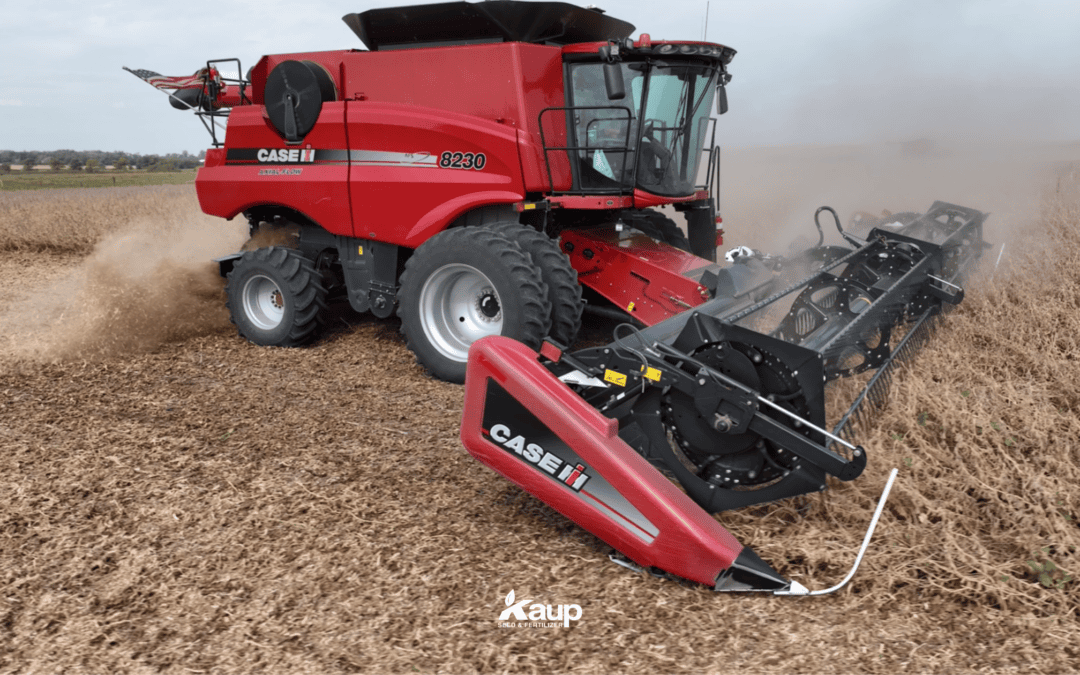
Running a Clean Harvest: What to Do While the Combine Is Rolling
By September across Cuming County and the neighboring northeast Nebraska counties, the combines are running. Corn soybean harvest management stops being a plan and becomes a series of decisions you make in real time, most of them from the cab. Soybeans come off first. Corn follows through October. The days are long, the weather window is unpredictable, and everything else on the operation stops.
Here’s what separates a good harvest from a great one: the growers who treat harvest as collection get whatever the machine gives them. The growers who treat harvest as management get more of what they grew. They also get better information for next year.
Both are running the same combine. The difference is what they’re checking while it’s moving.
This is the month where a poorly calibrated yield monitor quietly ruins your entire fertility plan for next season. Where two bushels per acre of harvest loss walks out the back of the combine unnoticed across every field. Where corn binned at the wrong moisture becomes a storage problem in January. And where the fields coming out right now are your only chance to get soil samples pulled before October fills up.
None of it takes long. All of it matters.
Your Yield Data Is Only As Good As Your Calibration
Let’s start with the one that costs the most and gets skipped the most.
Yield Monitors Don’t Measure Yield
This is the fundamental thing most growers misunderstand. Purdue Extension puts it plainly: yield monitors don’t measure grain yield. They estimate it. The monitor converts electrical signals from a mass impact or optical sensor in the clean grain elevator into estimates of grain flow. It then combines that with estimates of distance traveled, header width, and grain moisture to produce an estimated yield per acre.
Every one of those inputs can drift. When they do, your yield map stops reflecting your field and starts reflecting your sensor error.
Iowa State Extension (2025) frames the stakes well: yield maps are like soil tests. You wouldn’t trust a soil test that wasn’t pulled properly. So why trust a monitor that isn’t calibrated?
Why It Matters More Than You Think
Your harvest data isn’t just a scorecard. It’s the foundation for:
- Variable rate fertilizer prescriptions for next season
- Hybrid and variety selection decisions
- Zone management within fields
- Field-by-field profitability analysis
- Determining which acres justify higher inputs
If the data going in is wrong, every decision built on it is wrong too. A yield map showing a low-producing zone that isn’t actually low-producing means you’ll under-invest in ground that could have paid you back.
The Moisture Problem in Corn
This calibration detail catches most growers.
Iowa State Extension (2025) documents that yield monitors in corn are especially sensitive to moisture changes. Corn harvested above 20% moisture requires recalibration every 2.5% change in moisture to keep yield monitor error under 5%.
Think about what that means across a northeast Nebraska harvest season. You start in late September at 22% moisture. By mid-October you’re at 18%. By late October you’re at 15%. That’s three separate recalibration points on the same crop. Most growers calibrate once.
The practical rule: Different mass flow sensor calibrations are needed for grain above and below 20% moisture. If you’re harvesting across that threshold, you need separate calibrations.
The Calibration Checklist
Before harvest starts:
- Pull out the yield monitor manual and read the calibration section
- Inspect the mass flow sensor for dirt buildup or debris
- Verify GPS and header width settings are correct
- Confirm your moisture sensor matches your local elevator or a certified tester
During calibration:
- Run multiple calibration loads (usually 2-6 loads of 3,000-5,000 lbs depending on your system)
- Vary grain flow rate across loads by changing combine speed or header width to capture the full yield range you expect
- Weigh each load on a grain cart or truck scale for ground truth
- Enter the true weight into the monitor display
Every crop, every time:
- Corn and soybeans require separate calibrations
- Different varieties or hybrids with different test weights may warrant recalibration
- Temperature swings during harvest affect sensor readings, so adjust as conditions change
Daily during harvest:
- Run through your calibration checklist every morning before you start
- Watch for drift in yield readings that don’t match field conditions
- Recalibrate when moisture shifts more than 2.5 points in corn
The time investment is real. So is the return. A properly calibrated monitor produces data you can build a fertility program on. An uncalibrated one produces expensive fiction.
Measuring Harvest Loss: The Bushels You Can’t See
The second-most-skipped harvest task, and the one with the most immediate financial impact.
What Acceptable Loss Looks Like
Harvest loss is inevitable. Excessive harvest loss is a settings problem.
NDSU Extension targets total corn and soybean harvest loss at 1-2 bushels per acre. Michigan State Extension (2023) documents that soybean harvest losses usually range from 1-2 bushels per acre under good conditions, or roughly 2-4% of total potential yield.
But losses climb fast when conditions aren’t ideal. Soybean losses can reach as much as 15% when plants are short with low-hanging pods, lodged, have green or tough stems, or contain brittle pods from harvest delays.
On 160 acres, the difference between 2 bushels of loss and 6 bushels of loss is 640 bushels. That’s not a rounding error.
How to Measure Corn Loss
You need a one-square-foot frame and a tape measure.
The process:
- Combine at your normal settings and speed for at least 100 feet past the end rows
- Suddenly shut off the header and threshing unit – (perform a powershutdown)
- Back the combine up about 5 feet, no more
- Get out with your tools
Why only 5 feet: Header loss lands in front of the machine. Tail loss lands behind it. Back up too far and you drive over the boundary between those two zones, mixing them together. Once that happens you can count total loss but you can’t tell whether the header or the back of the machine is costing you the bushels. Five feet is enough room to work and still keep the zones separate.
Pre-harvest loss (what was already on the ground):
- Throw the square into the unharvested corn ahead of the header
- Count kernels inside the frame
- Repeat 4-6 times and average
- Two kernels per square foot equals about 1 bushel per acre loss
Ear loss:
- In the unharvested area, count ears on the ground in 1/100 of an acre
- For 30-inch rows: 6-row head = 29 feet, 8-row head = 22 feet, 12-row head = 14 feet 8 inches
- One ear in 1/100 acre equals roughly 1 bushel per acre
Header loss:
- Place the square between the header and the unharvested crop
- Count kernels, repeat 4-6 times, average
Machine loss:
- Subtract pre-harvest loss from total loss to isolate what the machine is causing
How to Measure Soybean Loss
Simpler. You only need the square-foot frame.
UNL CropWatch (2023) documents the conversion, which varies by seed size:
| Soybean Seed Size | Seeds per sq. ft. = 1 bu/acre |
| Small | 5 seeds |
| Medium | 4 seeds |
| Large | 3 seeds |
The process:
- Stop in a representative area of the field, back up 5 feet
- Count beans in the frame in the harvested area in front of the header
- Take at least four counts across the full header width
- Divide the average by 4 (for medium seed) to get bushels per acre lost
Where the loss happens: Michigan State Extension documents that 80% of soybean harvest losses occur at the header. That’s where your adjustment effort should focus.
The Adjustment Discipline
Make one adjustment at a time. Stop and re-measure. Then make the next one.
Changing three settings simultaneously means you have no idea which one helped. The measurement takes five minutes. Guessing costs bushels for the rest of the season.
Common adjustment points:
- Reel speed and height (soybeans, the single biggest header loss factor)
- Cutting height (get low enough to catch bottom pods without picking up dirt)
- Ground speed (faster isn’t always more productive if loss climbs)
- Deck plate spacing (corn, matched to ear size)
- Rotor and concave settings (threshing loss)
Penn State Extension (2025) adds a downstream benefit that often gets overlooked: minimizing corn harvest loss also reduces volunteer corn pressure the following season. Research in Nebraska found that just one volunteer corn plant per square meter reduced soybean yield by 22%.
Every kernel you leave on the ground this fall is a weed next spring.
Moisture and Drying Decisions
The decision to harvest now or wait is the most expensive judgment call of the season. And it changes every week.
The Field Drydown Timeline
Iowa State Extension estimates weekly in-field corn drying at:
- September: 4.5 moisture points per week
- October: 2.5 points per week
- November: 1.0 point per week
- December: 0.5 points per week
That declining curve is the entire economics of the decision. Corn left standing in September dries fast and free. Corn left standing in November barely dries at all, while stalk quality deteriorates and lodging risk climbs.
The Cost of Waiting Versus Drying
Waiting costs you:
- Standability risk (stalk rot, lodging, ear drop)
- Field loss from deteriorating plant integrity
- Weather exposure (wind events, early snow)
- Harvest window compression if everything matures at once
Drying costs you:
- Propane or electricity
- Dryer throughput limits your combine pace
- Handling time and equipment wear
The drying cost equation also shifts with the calendar. Iowa State notes that high-temperature dryer costs increase around 14% with every 20-degree decrease in average outdoor temperature. Drying in late October costs meaningfully more per point than drying in late September.
The Wet Corn Danger Window
This is where September harvest gets genuinely risky.
Warm, wet corn generates its own heat. Iowa State Extension (2025) documents that biological activity can raise grain temperature fast. It takes at least 0.25 cubic feet of air per minute per bushel to pull that heat back out.
The deterioration math is unforgiving: the holding period before quality grade damage occurs is roughly cut in half for every 2 additional points of moisture. Corn damage from holding happens about twice as fast at 21% moisture as it does at 19% moisture.
Practical rules for wet corn:
- Keep wet corn aeration holding times under 24 hours
- Corn at 20% moisture can usually be dried within 12 hours in a continuous-flow dryer
- Corn at 25% moisture requires roughly 22 hours
- Bin dryers using natural air or low heat struggle during mild fall temperatures
- Continuous-flow dryers at higher temperatures are the better tool early in harvest
One important clarification: Drying increases test weight by making the grain sample denser. It does not increase actual yield or the amount of sellable dry matter. You’re not gaining bushels by drying. You’re protecting the ones you have.
Soybean Moisture Timing
Soybeans dry differently and require a different mindset.
Soybeans usually dry naturally in the field and reach harvest moisture around 13%. The bigger soybean risk isn’t drying cost. It’s shatter loss from harvesting too dry. Beans harvested below 11% moisture shatter more easily at the header, and you’re also selling water weight you already lost.
The soybean rule: Harvest as close to 13% as your schedule allows. Below 11%, shatter loss climbs and you’re giving away weight.
The Soil Connection Across the Region
Fields don’t all reach harvest moisture at the same time, and soil type is part of why. The same three soil types show up across Cuming, Dodge, Colfax, Stanton, Burt, Thurston, and Wayne counties, and each one dries on its own schedule.
Thurman-Blendon sandy loams dry down fastest. Lower water-holding capacity means these fields usually hit harvestable moisture first. They are also the most likely to over-dry if left standing.
Nora silt loam holds moisture longer through the profile, supporting later maturity and slower drydown.
Moody complex varies by zone. Low areas may lag significantly behind hilltops in the same field, which complicates a single harvest timing decision.
This is why harvest order should be planned field-by-field, not just by planting date.
Grain Storage: Getting It In Is Only Half the Battle
Grain that goes in the bin wrong doesn’t stay good. And storage problems don’t announce themselves until the damage is already substantial.
Target Storage Moisture
Corn: 15% for winter storage, 13.5-14% if holding into summer Soybeans: 13% for storage
Purdue Extension is direct about the tolerance: all of the grain in storage must be at or below the maximum. Pockets of higher-moisture grain will likely spoil. Averaging doesn’t work. A bin averaging 15% with a wet core is a bin with a problem developing.
Why Temperature Control Matters
Improper temperature control causes moisture to migrate from one part of the grain mass to another, where it accumulates and causes spoilage. This is the mechanism behind most storage failures.
Warm grain in a cold bin creates convection currents. Moisture moves from the warm center to the cold outer grain and condenses. By the time you find the crust, the problem has been building for weeks.
Aeration best practices:
- Cool grain down for winter storage in stages as ambient temperature drops
- Don’t operate suction aeration systems until several feet of grain are in the bin (prevents pulling fines toward the duct)
- Cover aeration fans when not in use. Warm moist air drawn through uncovered fans condenses on cold ducts and floors
- Check stored grain weekly during critical fall and spring months, and at least every two weeks through winter
Mechanical Damage Compounds Everything
Here’s a connection most growers don’t make: how you harvest affects how long you can store.
Allowable storage times published by extension are usually based on clean corn with about 30% mechanical damage. Research shows that at 40% mechanical damage, allowable storage time is cut in half.
Combine settings that crack kernels don’t just cost you at the elevator on grade. They cut your storage window before spoilage risk climbs.
The connection: Rotor speed and concave clearance that beat up grain during threshing create a storage problem you’ll discover in February.
Bin Prep Checklist
Before the first load goes in:
- Inspect for leaks, damaged grain doors, and pest entry points
- Clean out old grain residue completely (old grain harbors insects and mold)
- Test aeration fans and verify airflow
- Confirm temperature monitoring equipment is functional
- Check that unloading equipment operates properly
- Verify safety equipment and lockout procedures are in place
Kaup’s storage prep consultation covers aeration timing, temperature monitoring, and moisture targets for safe long-term storage. Getting the conditions right protects the entire year’s investment. A bin of grain stored at the wrong moisture or temperature can lose significant value or become unsaleable.
Soil Sampling Starts Now, Not in October
This is the September action item that pays the biggest downstream dividend and gets deferred the most.
The Combine Clears the Field, the Probe Goes In Right Behind It
As fields come out of harvest, sampling can begin immediately. There’s no reason to wait for the whole operation to finish.
Why September sampling beats October sampling:
- Earlier sampling means earlier lab results
- Results in hand by early October means the full fall application window is available
- The full window means lime, phosphorus, potassium, and specialty products can all be applied before ground freeze
- Fields sampled in late October may not have results back until November, which compresses everything
The scheduling reality: October books fast for soil sampling. Every grower wants the same thing at the same time, and capacity is finite. Growers who get on the schedule in September are first in line when their fields clear.
What Soil Sampling Actually Determines
Soil nutrients can’t be seen or felt. Testing is the only way to know what a field actually needs. It is also the only way to know what it already has.
Every product recommendation for next season starts here:
- Lime rate (pH correction takes months to work, so fall application is essential)
- Phosphorus and potassium rates
- Whether specialty phosphorus products make sense on that ground
- Variable rate prescriptions when combined with yield data
- Nitrogen planning based on organic matter and residual
Guessing costs money on products the field didn’t need. It also costs yield on nutrients the field needed but didn’t get.
The Yield Data Connection
This is where Section 1 and Section 5 come together.
Soil test results layered over yield history on a field map make patterns obvious that neither data set reveals alone. A low-yielding zone with adequate fertility is a different problem than a low-yielding zone with a pH issue. You can’t tell them apart without both data sets.
This is exactly why yield monitor calibration matters. Bad yield data layered over good soil data produces a map that sends you in the wrong direction.
Talk to your Kaup agronomist about getting on the soil sampling schedule now, while harvest is still running.
Where Corn Soybean Harvest Management Actually Breaks Down
Most growers think about combine capacity. The bottleneck is usually somewhere else.
Common Bottleneck Points
Grain cart capacity: If the combine has to wait for the cart, you’re losing harvest hours during your best weather windows.
Truck and trailer availability: Road time to the elevator or bin site is often the real constraint on a high-yield day.
Dryer throughput: If you can harvest 100 acres a day but can only dry 60 acres worth of grain, the dryer sets your pace regardless of combine capacity.
Bin filling sequence: Filling the wrong bin first can create handling problems later, especially when segregating by moisture or quality.
Working the Math Backward
If your typical pace is 80-100 acres per day:
- 320 acres equals 3-4 days of actual combining
- Add weather delays and it becomes 5-7 calendar days
- Add drying cycles and the grain in/out timeline extends further
Planning that sequence before harvest starts prevents the mid-season scramble where equipment sits idle waiting on something else.
Harvest Order Strategy
Fields shouldn’t be harvested strictly in maturity order. Prioritize by risk:
- Lodging risk fields first. Severe disease pressure, storm damage, premature death
- Failed push test fields second. Stalk integrity is compromised (see our August finish-line checklist for how to run the push test)
- High-yield fields third. More to lose if standability fails, worth harvesting slightly wet to protect it
- Stable fields last. Good standability can safely dry down in the field
Kaup’s custom harvest support helps with grain cart operation, transport coordination, and harvest timing advice based on moisture readings. Every extra hour of efficient harvest during an open weather window has real value. And every bottleneck during that window has a real cost.
What Harvest Tells You About Next Season
Harvest is the best diagnostic window of the entire year. The crop is telling you exactly what worked and what didn’t. You just have to be paying attention while you’re in the field.
What to Document While You’re Combining
Standability by field: Which fields lodged? Which held up? Fields with poor standability had a stress event during grain fill: disease, drought, or nutrient shortfall. That’s a note for next year’s fungicide or fertility plan.
Yield patterns within fields: Consistent low zones point to drainage, compaction, or fertility issues. Random low spots point to weather or pest events. The pattern tells you whether it’s fixable.
Weed escapes: Weeds visible at harvest are seeds in the seedbank for next year. Note the species and location. This drives the herbicide program conversation in December.
Disease and ear rot: Note any field with visible ear rot or heavy late-season foliar disease. Those fields are candidates for a different hybrid or a stronger fungicide program next year.
Moisture variability: Fields drying at very different rates may indicate a hybrid maturity mismatch to that ground, or drainage differences worth addressing.
Why Document Now Instead of Later
Because December is too late. When you sit down to plan next year’s seed and inputs, you won’t remember which corner of which field had the problem. You’ll remember the field average.
Take five minutes to note what you see, field by field. You’ll walk into the planning meeting with real detail instead of a three-month-old memory.
A phone note, a voice memo, a photo. The format doesn’t matter. The record does.
Conclusion
September in Cuming County is the month where the year’s work becomes the year’s result. But harvest isn’t a passive process. Every hour in the cab includes decisions that determine whether you keep what you grew.
Calibrate the yield monitor, and every fertility decision next year rests on real data instead of sensor drift. Measure harvest loss, and you find the bushels quietly walking out the back of the combine. Get moisture and storage right, and the grain that goes in the bin is still worth something in February. Schedule soil sampling now, and you have the full fall window to act on what the results tell you.
None of these take much time. All of them compound.
The operations across the region that consistently outperform aren’t running better combines. They’re running the same combines with better information, because they stopped, checked, measured, and adjusted while everyone else was just trying to get done.
Harvest is the last chance to protect this year’s crop. It’s also the first chance to plan next year’s.
Call to Action
Is your harvest working as hard as you are?
Between yield monitor calibration, harvest loss measurement, moisture and drying decisions, and getting soil samples scheduled before October fills up, there’s a lot happening in a short window. And most of it has to happen while the combine is still moving.
Maybe you need harvest logistics support to keep things moving during an open weather window. Maybe it’s storage prep so grain holds its value through winter. Maybe it’s getting on the soil sampling schedule while your fields are clearing. We’ve worked harvests across Cuming, Dodge, Colfax, Stanton, Burt, Thurston, and Wayne counties long enough to know where the bottlenecks are and what the data is worth.
Talk to a local expert today.